
Skills & Tools Used:
✔ Google Sheets (IMPORTRANGE) – Data Integration
✔ Data Cleaning & Transformation
✔ Looker Studio – Interactive Dashboard & Visualization
Project Overview
Managing advertising performance across multiple teams and products can be challenging. To streamline performance tracking and decision-making, I consolidated all advertising data into a single source and built an interactive dashboard in Looker Studio.
Project Workflow
Data Consolidation: Merged multiple datasets using IMPORTRANGE in Google Sheets to create a unified database.
Data Cleaning & Preparation: Standardized formats, removed inconsistencies, and ensured the dataset was optimized for visualization.
Dashboard Development: Designed an interactive Looker Studio dashboard to analyze advertising performance by month, division, and product.
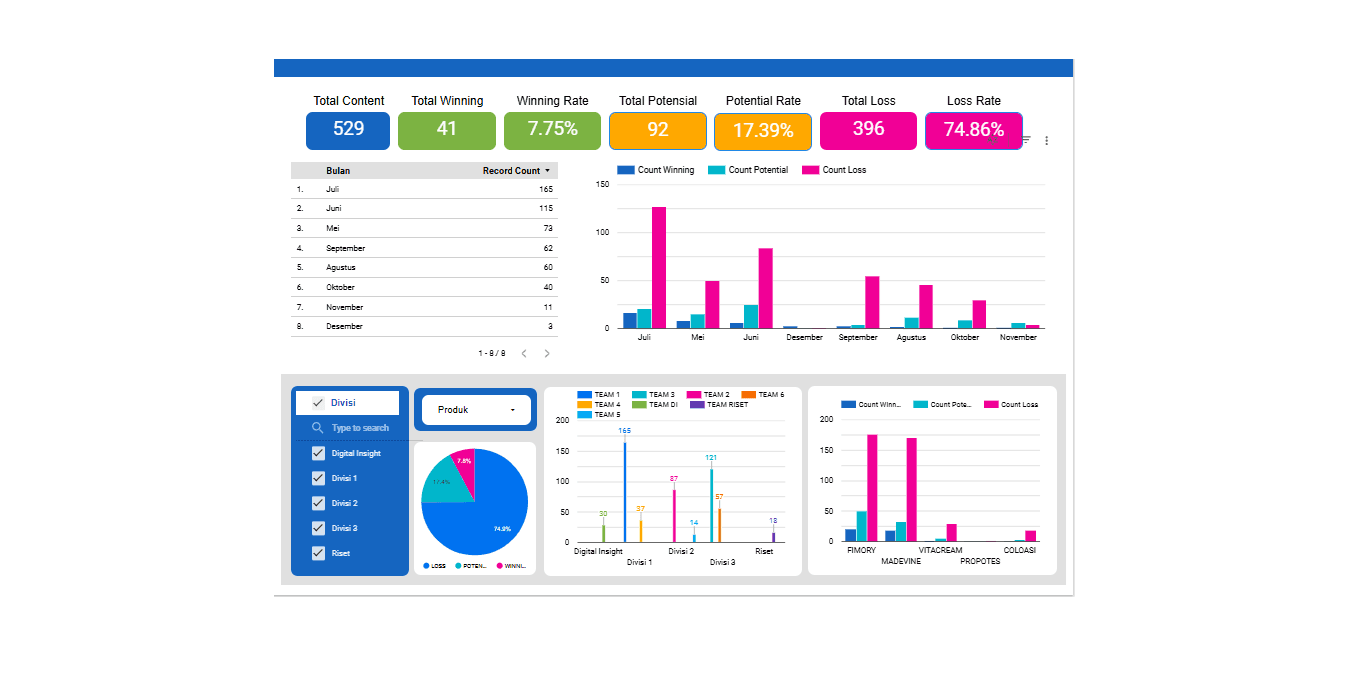
Key Performance Metrics
📊 Total Content Published: 529
🏆 Winning Content: 41 (7.75% success rate)
⚡ Potential Content: 92 (17.39% engagement rate)
❌ Lost Content: 396 (74.86% loss rate)
July had the highest content volume (165 campaigns) but also the most losses.
Fimory and Madevine were the best-performing products in terms of engagement.
Winning Content Analysis
From deeper analysis of winning content types and models, the following insights were discovered:
📌 Performance by Division
Tim Riset had the highest winning percentage relative to their total content.
However, Divisi 1 produced more winning content overall, meaning they had a much larger content volume.
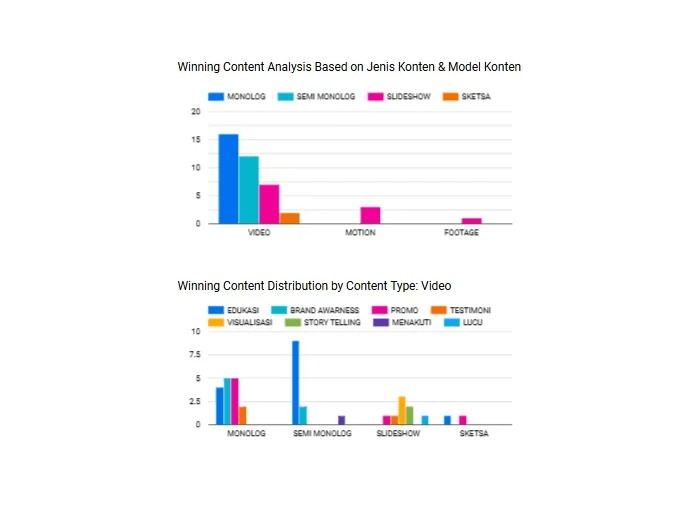
📌 Winning Content by Type & Model
Video was the most successful content type, significantly outperforming other formats.
Within video content, the monologue model had the highest success rate, followed by semi-monologue.
📌 Winning Video Content by Theme
Monologue videos dominated winning content, and within this category:
Promo and brand awareness themes were the most successful.
Educational, storytelling, and testimonial videos had lower success rates.
Impact & Next Steps
✅ Clear performance tracking for teams & content strategy
✅ Identifying successful content types for future optimization
✅ Opportunities to refine underperforming formats & themes