
Skills & Tools Used
✔ Power BI – Data Visualization & Dashboarding
✔ Excel – Data Cleaning & Structuring
✔ Data Analytics – Identifying Key Trends
Overview
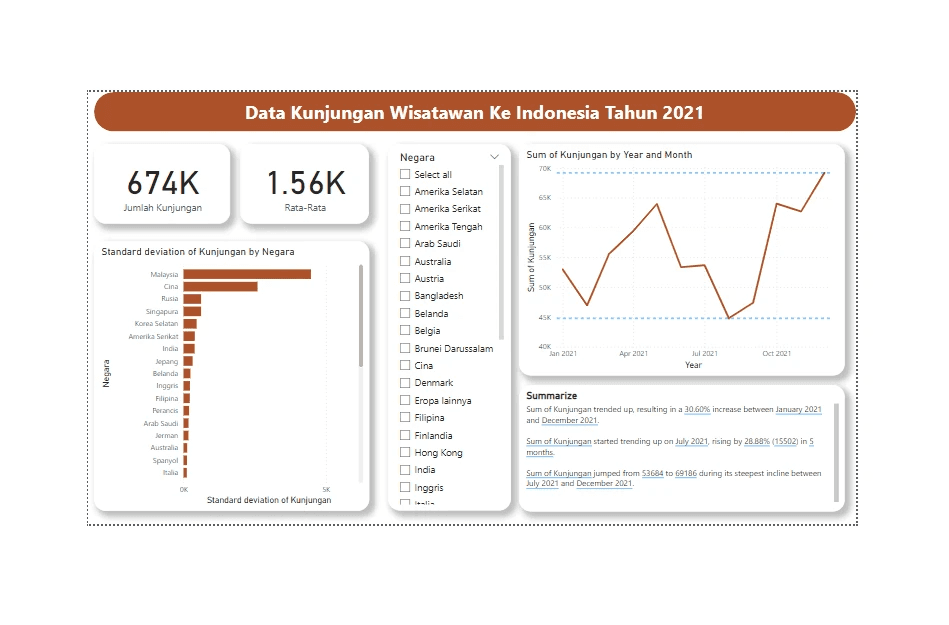
This project focuses on analyzing international tourist arrivals to Indonesia in 2021 using official data from BPS. By examining visitor numbers, regional spending, and stay durations, this dashboard provides valuable insights into travel recovery trends post-pandemic and identifies key source markets for Indonesia’s tourism sector.
Project Workflow
Data Collection & Processing
Source: Official tourism data from BPS (Statistics Indonesia)
Data Cleaning & Structuring: Ensured consistency in visitor records, spending, and stay duration by country and continent
Dashboard Development: Created an interactive Power BI dashboard for visualizing trends
Key Metrics & Insights
Top Visitor Origins
Malaysia had the highest number of visitors, far surpassing other countries
China and the United States followed as the second and third largest sources of visitors
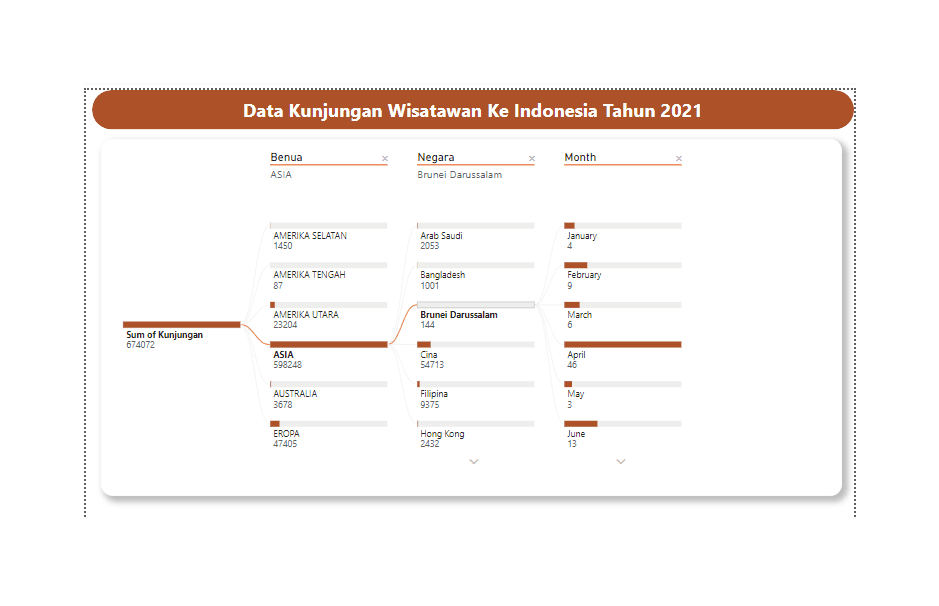
The Asia region dominated in total visits, reinforcing its strong travel ties with Indonesia
Spending & Stay Duration
European tourists spent the most during their stay in Indonesia
Europe also had the longest average stay, indicating high-value, long-term travelers
Asia followed closely in stay duration, showing sustained travel interest
Tourism Trends Over Time
The overall trend shows a fluctuating yet upward trajectory in tourist arrivals throughout 2021.
From July to September, the number of visitors actually declined before experiencing a sharp rebound.
A consistent increase began in October 2021 and peaked in early 2022, stabilizing at around 70K visitors.
Impact & Next Steps
Identified high-value markets for targeted tourism campaigns
Recognized key spending patterns to optimize tourism revenue strategies
Analyzed seasonal trends to inform travel policies and marketing