Skills & Tools Used
✔ Power BI – Data visualization & dashboard creation
✔ DAX – Advanced calculations & measures
✔ Data Storytelling – Communicating insights effectively
Overview
This section showcases a collection of Power BI dashboards created as part of my coursework during an independent study program. Each project involved different datasets and analytical approaches, emphasizing key business metrics, trends, and actionable insights.
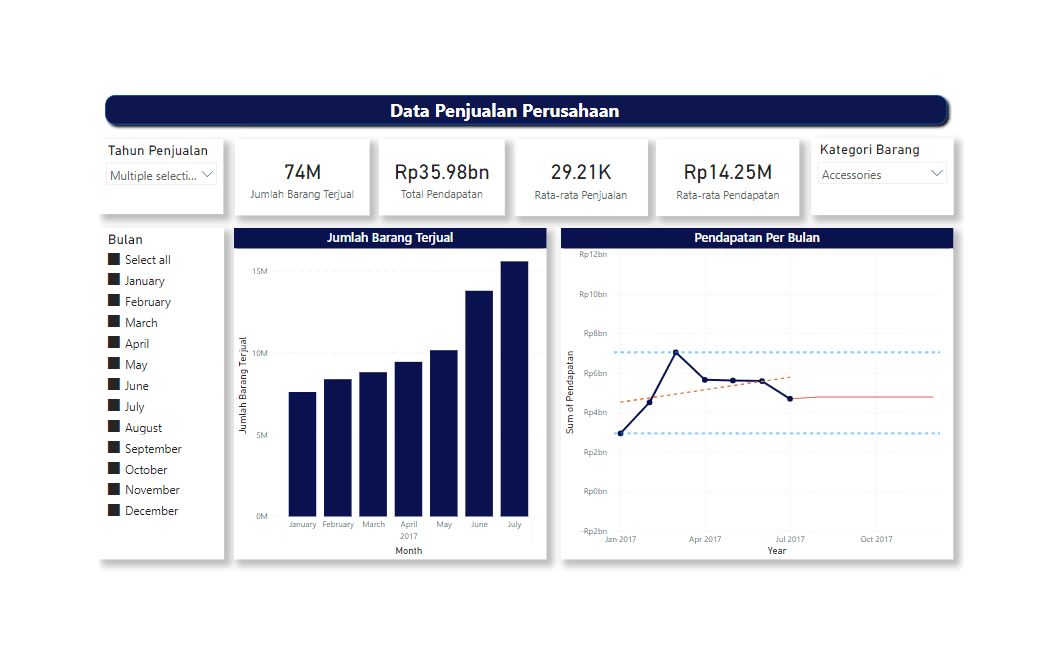
Project 1: Company Sales Dashboard
Objective:
To analyze company sales performance, including total revenue, product sales trends, and monthly revenue fluctuations.
Key Metrics & Insights:
74M+ Units Sold – Tracking total product sales across all categories.
Rp35.98Bn Total Revenue – Summarizing the overall financial performance.
Average Sales per Transaction: 29.21K – Understanding the purchasing behavior.
Revenue Fluctuation per Month – Identifying high-performing months.
Dashboard Features:
Filters for Year and Month Selection – Allowing users to explore specific time frames.
Product Category Selection – Focused insights based on product types.
Trend Analysis – Monthly revenue performance with projected trends.
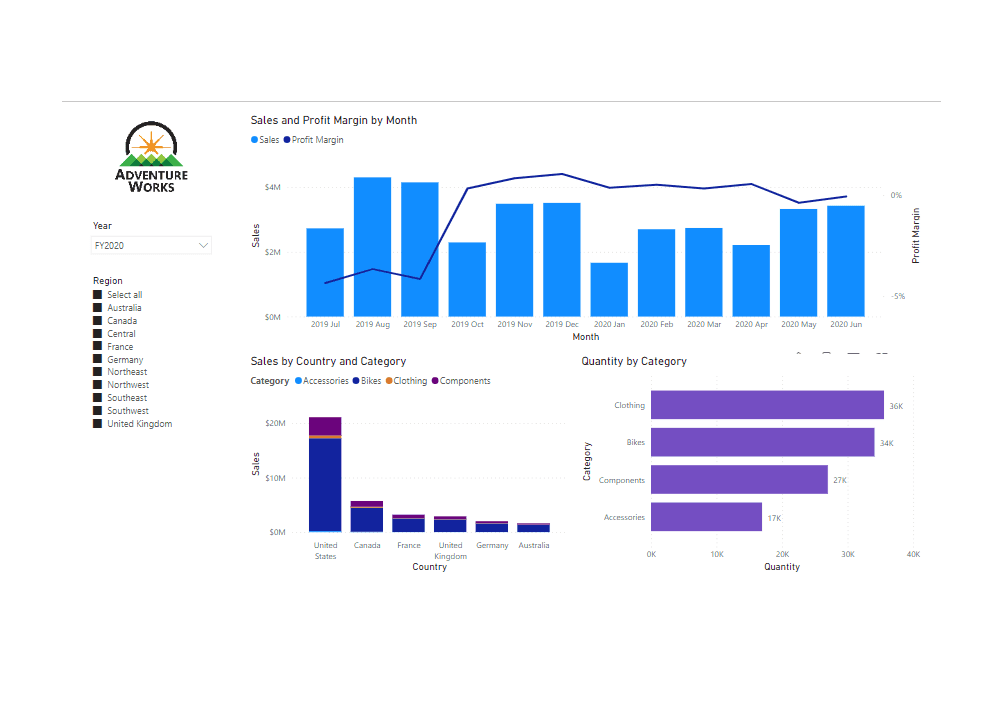
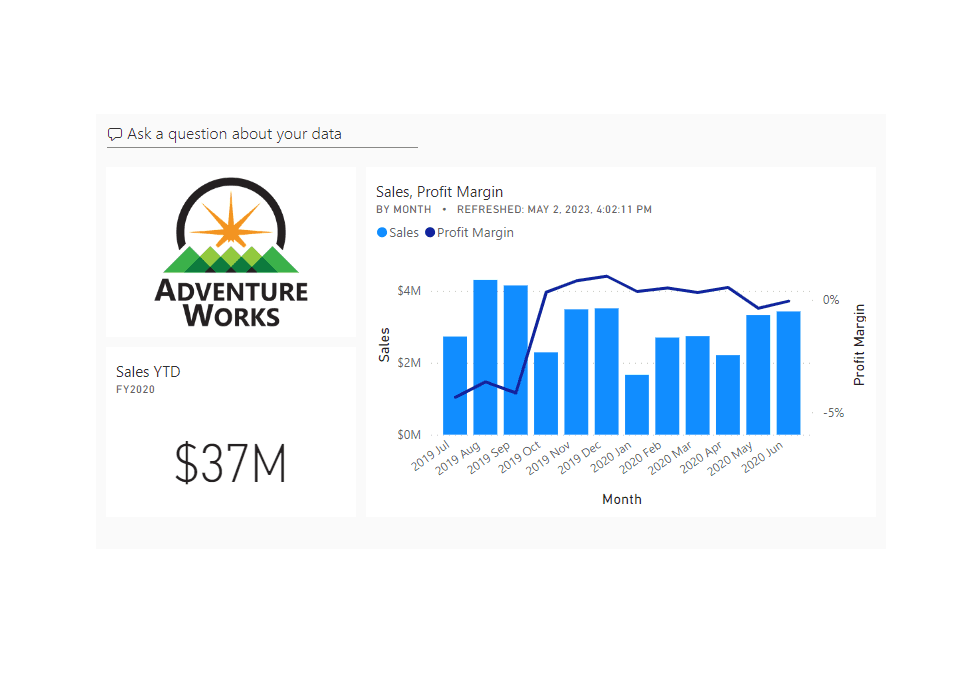
Project 2: Adventure Works Sales Analysis
Objective:
To visualize global sales data, profit margins, and category-wise performance across different regions.
Key Metrics & Insights:
Sales & Profit Margin Trends – Monitoring financial growth over time.
Top-Selling Product Categories – Clothing and Bikes leading in quantity sold.
Geographical Sales Distribution – The U.S. dominates sales, followed by Canada and France.
Dashboard Features:
Monthly Sales & Profit Margin Tracking – Identifying peak sales periods.
Regional Breakdown – Understanding market demand across different countries.
Product Category Comparison – Evaluating sales performance by category.