• SALSADILA AULIA FAUZI

Person 3

Bachelor of Statistics

Person 3

Bachelor of Statistics

Hello, I'm Salsadila!

Hello, I'm Salsadila!

Hello, I'm Salsadila!

Data Enthusiast

HTML5/CSS3 Mastery

Product Design

Branding

Collaborative Team Player

Data Enthusiast

HTML5/CSS3 Mastery

Product Design

Branding

Collaborative Team Player

✦ SCROLL DOWN ✦ AND KNOW ME BETTER
Profile Picture
✦ SCROLL DOWN ✦ AND KNOW ME BETTER
Profile Picture
✦ SCROLL DOWN ✦ AND KNOW ME BETTER
Profile Picture
Orange Pyramid
Orange Pyramid
Orange Pyramid
Purple Sphere
Purple Sphere
Purple Sphere
Blue Cylinder
Blue Cylinder
Blue Cylinder
Turquoise Star
Turquoise Star
Turquoise Star
Lime Green Object
Lime Green Object
Lime Green Object
Yellow Cube
Yellow Cube
Yellow Cube
Purple Cube
Purple Cube
Purple Cube
Blue Pyramid
Blue Pyramid
Blue Pyramid

About Me

Hi! I'm Salsadila Aulia Fauzi,
a curious and self-motivated fresh graduate in Statistics from Gadjah Mada University with a strong passion for data. During my studies, I developed analytical skills while also gaining experience in teamwork and leadership through organizational activities.

Hi! I'm Salsadila Aulia Fauzi,
a curious and self-motivated fresh graduate in Statistics from Gadjah Mada University with a strong passion for data. During my studies, I developed analytical skills while also gaining experience in teamwork and leadership through organizational activities.

Hi! I'm Salsadila Aulia Fauzi,
a curious and self-motivated fresh graduate in Statistics from Gadjah Mada University with a strong passion for data. During my studies, I developed analytical skills while also gaining experience in teamwork and leadership through organizational activities.

I have built strong technical skills in data visualization and analysis using tools such as Python, Looker Studio, R, SPSS, Power BI, and Excel. I am highly committed to continuous learning and have a strong willingness to explore new methodologies and techniques in data analytics.

I have built strong technical skills in data visualization and analysis using tools such as Python, Looker Studio, R, SPSS, Power BI, and Excel. I am highly committed to continuous learning and have a strong willingness to explore new methodologies and techniques in data analytics.

I have built strong technical skills in data visualization and analysis using tools such as Python, Looker Studio, R, SPSS, Power BI, and Excel. I am highly committed to continuous learning and have a strong willingness to explore new methodologies and techniques in data analytics.

I am especially interested in Data Visualization and Analysis, particularly in human resources data, customer behavior, marketing performance, operational efficiency, and risk detection. I enjoy transforming raw data into valuable insights that support decision-making.

I am especially interested in Data Visualization and Analysis, particularly in human resources data, customer behavior, marketing performance, operational efficiency, and risk detection. I enjoy transforming raw data into valuable insights that support decision-making.

I am especially interested in Data Visualization and Analysis, particularly in human resources data, customer behavior, marketing performance, operational efficiency, and risk detection. I enjoy transforming raw data into valuable insights that support decision-making.

My Tools

Turquoise Cube
Turquoise Cube

Excel is my go-to tool for data preprocessing. I use it to create structured data tables, clean messy datasets, standardize formats, and generate insightful summaries using functions like PivotTables and conditional formatting.

Excel

Excel is my go-to tool for data preprocessing. I use it to create structured data tables, clean messy datasets, standardize formats, and generate insightful summaries using functions like PivotTables and conditional formatting.

Excel

Tap to flip

Excel is my go-to tool for data preprocessing. I use it to create structured data tables, clean messy datasets, standardize formats, and generate insightful summaries using functions like PivotTables and conditional formatting.

Excel

Tap to flip

I use Python for data analysis due to its versatility and powerful libraries. It helps me efficiently handle data preprocessing, perform statistical analysis, and build machine learning models, making it an essential tool for my data-driven projects.

Python

I use Python for data analysis due to its versatility and powerful libraries. It helps me efficiently handle data preprocessing, perform statistical analysis, and build machine learning models, making it an essential tool for my data-driven projects.

Python

Tap to flip

I use Python for data analysis due to its versatility and powerful libraries. It helps me efficiently handle data preprocessing, perform statistical analysis, and build machine learning models, making it an essential tool for my data-driven projects.

Python

Tap to flip

Visual Studio Code is my preferred IDE where I use Python and Jupyter notebooks for my projects. Its intuitive interface, flexibility, and robust features helping me manage data analysis workflows efficiently.

VSCode

Visual Studio Code is my preferred IDE where I use Python and Jupyter notebooks for my projects. Its intuitive interface, flexibility, and robust features helping me manage data analysis workflows efficiently.

VSCode

Tap to flip

Visual Studio Code is my preferred IDE where I use Python and Jupyter notebooks for my projects. Its intuitive interface, flexibility, and robust features helping me manage data analysis workflows efficiently.

VSCode

Tap to flip

Google Colab is my cloud-based solution for data science work, offering free GPU access and pre-installed libraries for developing machine learning models and sharing interactive notebooks seamlessly.

Google Colab

Google Colab is my cloud-based solution for data science work, offering free GPU access and pre-installed libraries for developing machine learning models and sharing interactive notebooks seamlessly.

Google Colab

Tap to flip

Google Colab is my cloud-based solution for data science work, offering free GPU access and pre-installed libraries for developing machine learning models and sharing interactive notebooks seamlessly.

Google Colab

Tap to flip

In Power BI, I create interactive dashboards and visualizations to uncover insights from data. Its powerful features, like DAX and Power Query, help me transform raw data into meaningful reports efficiently.

Power BI

In Power BI, I create interactive dashboards and visualizations to uncover insights from data. Its powerful features, like DAX and Power Query, help me transform raw data into meaningful reports efficiently.

Power BI

Tap to flip

In Power BI, I create interactive dashboards and visualizations to uncover insights from data. Its powerful features, like DAX and Power Query, help me transform raw data into meaningful reports efficiently.

Power BI

Tap to flip

Looker Studio is my choice for professional data visualization, leveraging its direct data connections and user-friendly interface to build interactive dashboards and automated reports.

Looker Studio

Looker Studio is my choice for professional data visualization, leveraging its direct data connections and user-friendly interface to build interactive dashboards and automated reports.

Looker Studio

Tap to flip

Looker Studio is my choice for professional data visualization, leveraging its direct data connections and user-friendly interface to build interactive dashboards and automated reports.

Looker Studio

Tap to flip

I used R Studio while studying statistics in college. It is the platform I learned for statistical computing, utilizing its comprehensive R programming support and statistical packages for advanced analysis and research projects.

R Studio

I used R Studio while studying statistics in college. It is the platform I learned for statistical computing, utilizing its comprehensive R programming support and statistical packages for advanced analysis and research projects.

R Studio

Tap to flip

I used R Studio while studying statistics in college. It is the platform I learned for statistical computing, utilizing its comprehensive R programming support and statistical packages for advanced analysis and research projects.

R Studio

Tap to flip

I utilize the easy-to-use Web Scraper extension to efficiently capture market data without the need to write any code. This intuitive tool simplifies the process, allowing me to easily extract valuable insights while skipping the complexity of programming scripts.

Web Scrapper

I utilize the easy-to-use Web Scraper extension to efficiently capture market data without the need to write any code. This intuitive tool simplifies the process, allowing me to easily extract valuable insights while skipping the complexity of programming scripts.

Web Scrapper

Tap to flip

I utilize the easy-to-use Web Scraper extension to efficiently capture market data without the need to write any code. This intuitive tool simplifies the process, allowing me to easily extract valuable insights while skipping the complexity of programming scripts.

Web Scrapper

Tap to flip

SPSS is another tool I used during my statistics studies. It is my reliable tool for statistical analysis, using its point-and-click interface and comprehensive procedures for survey analysis and hypothesis testing without extensive coding.

SPSS

SPSS is another tool I used during my statistics studies. It is my reliable tool for statistical analysis, using its point-and-click interface and comprehensive procedures for survey analysis and hypothesis testing without extensive coding.

SPSS

Tap to flip

SPSS is another tool I used during my statistics studies. It is my reliable tool for statistical analysis, using its point-and-click interface and comprehensive procedures for survey analysis and hypothesis testing without extensive coding.

SPSS

Tap to flip

I've explored the basics of BigQuery to get an understanding of how company databases work. While I haven’t applied it in a real case study yet, I’ve learned how it handles large datasets and enables efficient querying for data analysis.

Big Query

I've explored the basics of BigQuery to get an understanding of how company databases work. While I haven’t applied it in a real case study yet, I’ve learned how it handles large datasets and enables efficient querying for data analysis.

Big Query

Tap to flip

I've explored the basics of BigQuery to get an understanding of how company databases work. While I haven’t applied it in a real case study yet, I’ve learned how it handles large datasets and enables efficient querying for data analysis.

Big Query

Tap to flip

I use Google Sheets to seamlessly share data with other users in the company. Through this, I’ve learned to clean and organize datasets efficiently while also integrating data from multiple sources using IMPORTRANGE queries, ensuring smooth collaboration and real-time updates.

Google Sheet

I use Google Sheets to seamlessly share data with other users in the company. Through this, I’ve learned to clean and organize datasets efficiently while also integrating data from multiple sources using IMPORTRANGE queries, ensuring smooth collaboration and real-time updates.

Google Sheet

Tap to flip

I use Google Sheets to seamlessly share data with other users in the company. Through this, I’ve learned to clean and organize datasets efficiently while also integrating data from multiple sources using IMPORTRANGE queries, ensuring smooth collaboration and real-time updates.

Google Sheet

Tap to flip

CorelDraw is my go-to vector graphics editor for design purposes. I have the opportunity to use these precise tools and typography options to create logos and social media branding.

Corel Draw

CorelDraw is my go-to vector graphics editor for design purposes. I have the opportunity to use these precise tools and typography options to create logos and social media branding.

Corel Draw

Tap to flip

CorelDraw is my go-to vector graphics editor for design purposes. I have the opportunity to use these precise tools and typography options to create logos and social media branding.

Corel Draw

Tap to flip

Experiences

01

Data Analyst Principal -
PT Nusaindo Intermedia

01

Data Analyst Principal -
PT Nusaindo Intermedia

01

Data Analyst Principal -
PT Nusaindo Intermedia

01

Data Analyst Principal -
PT Nusaindo Intermedia

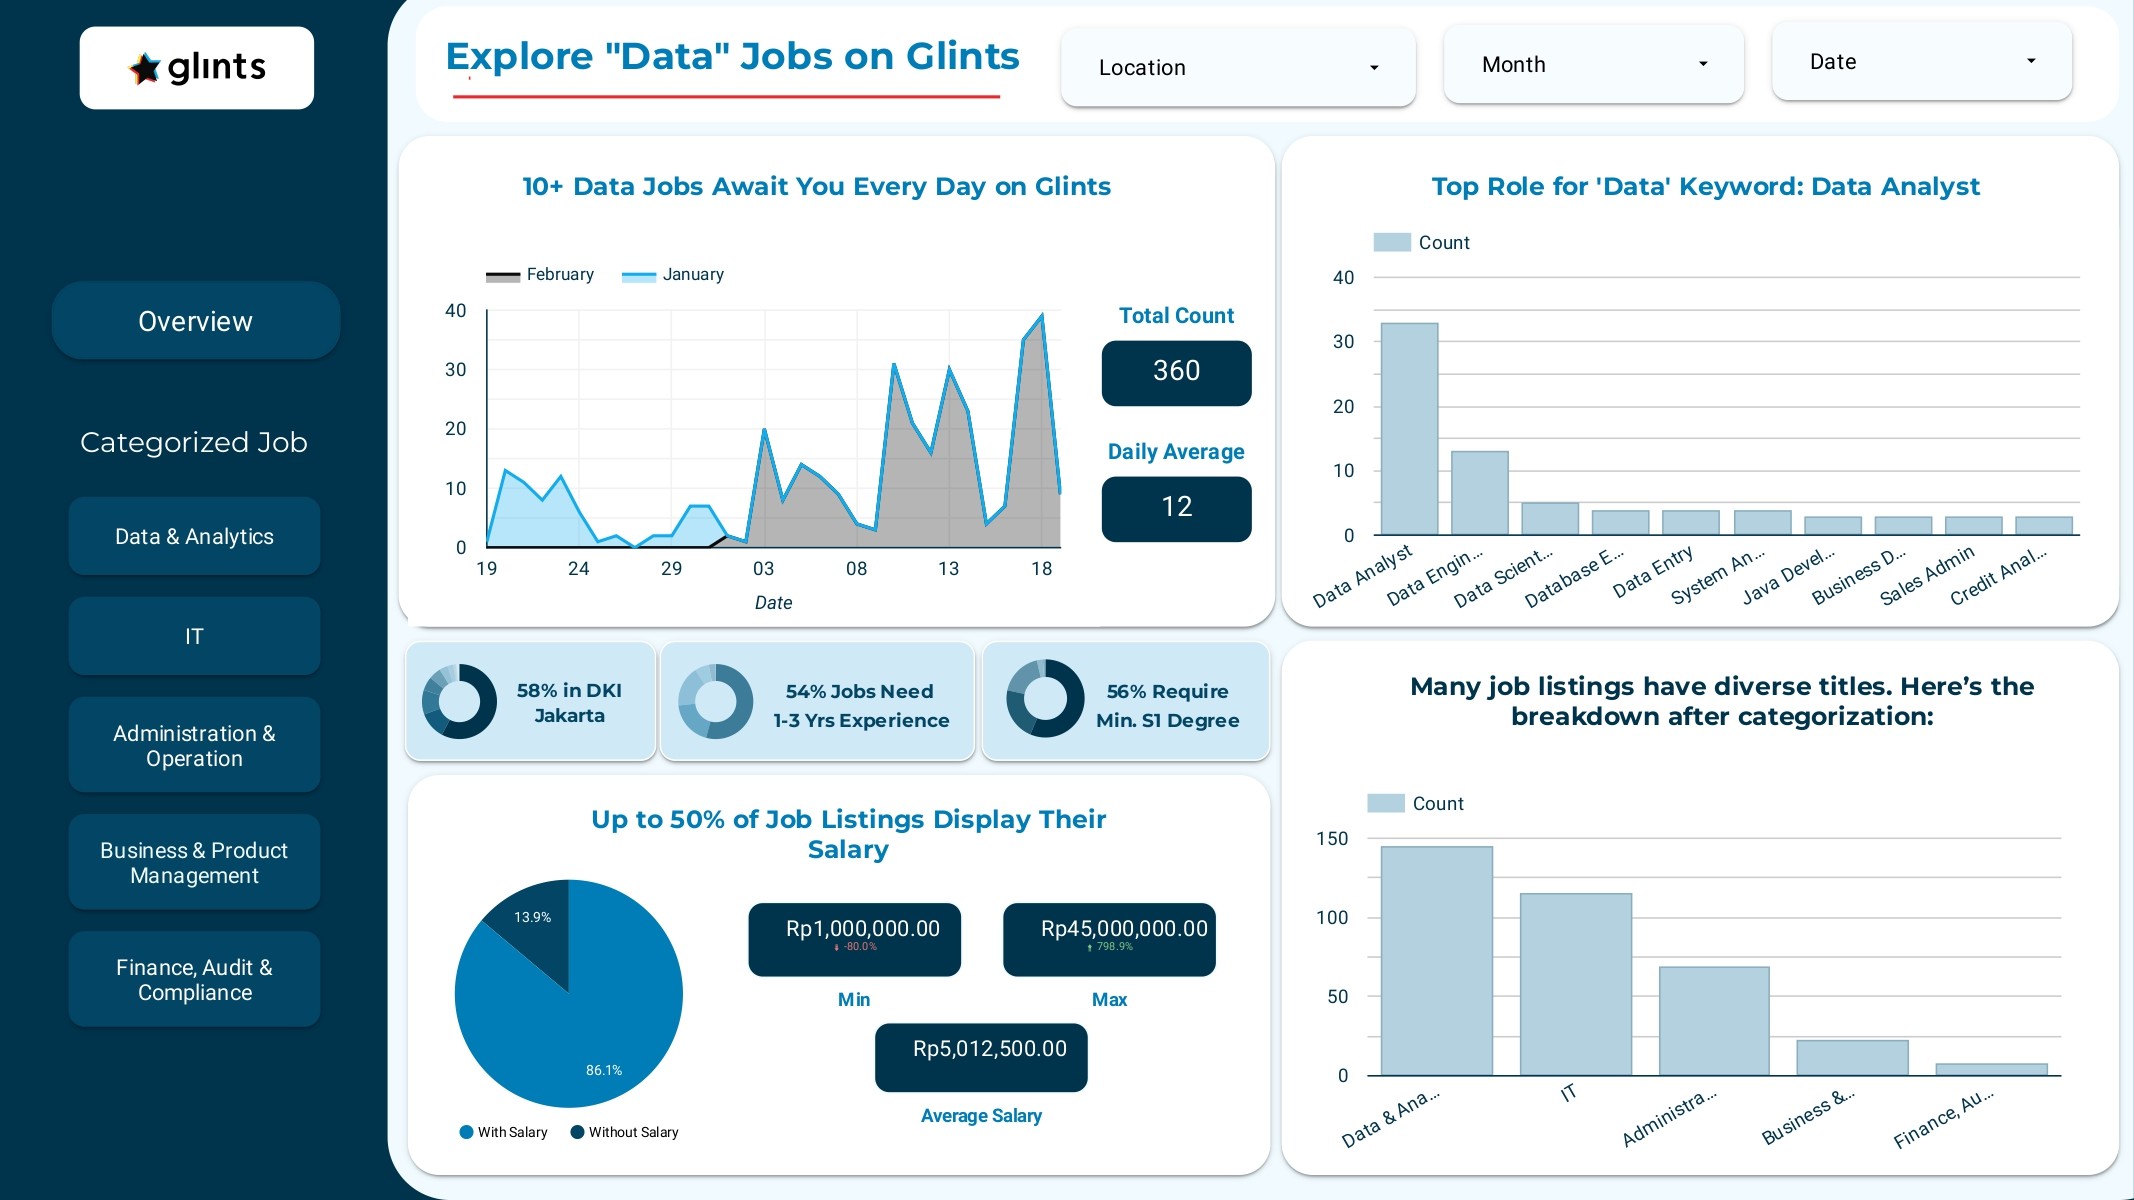
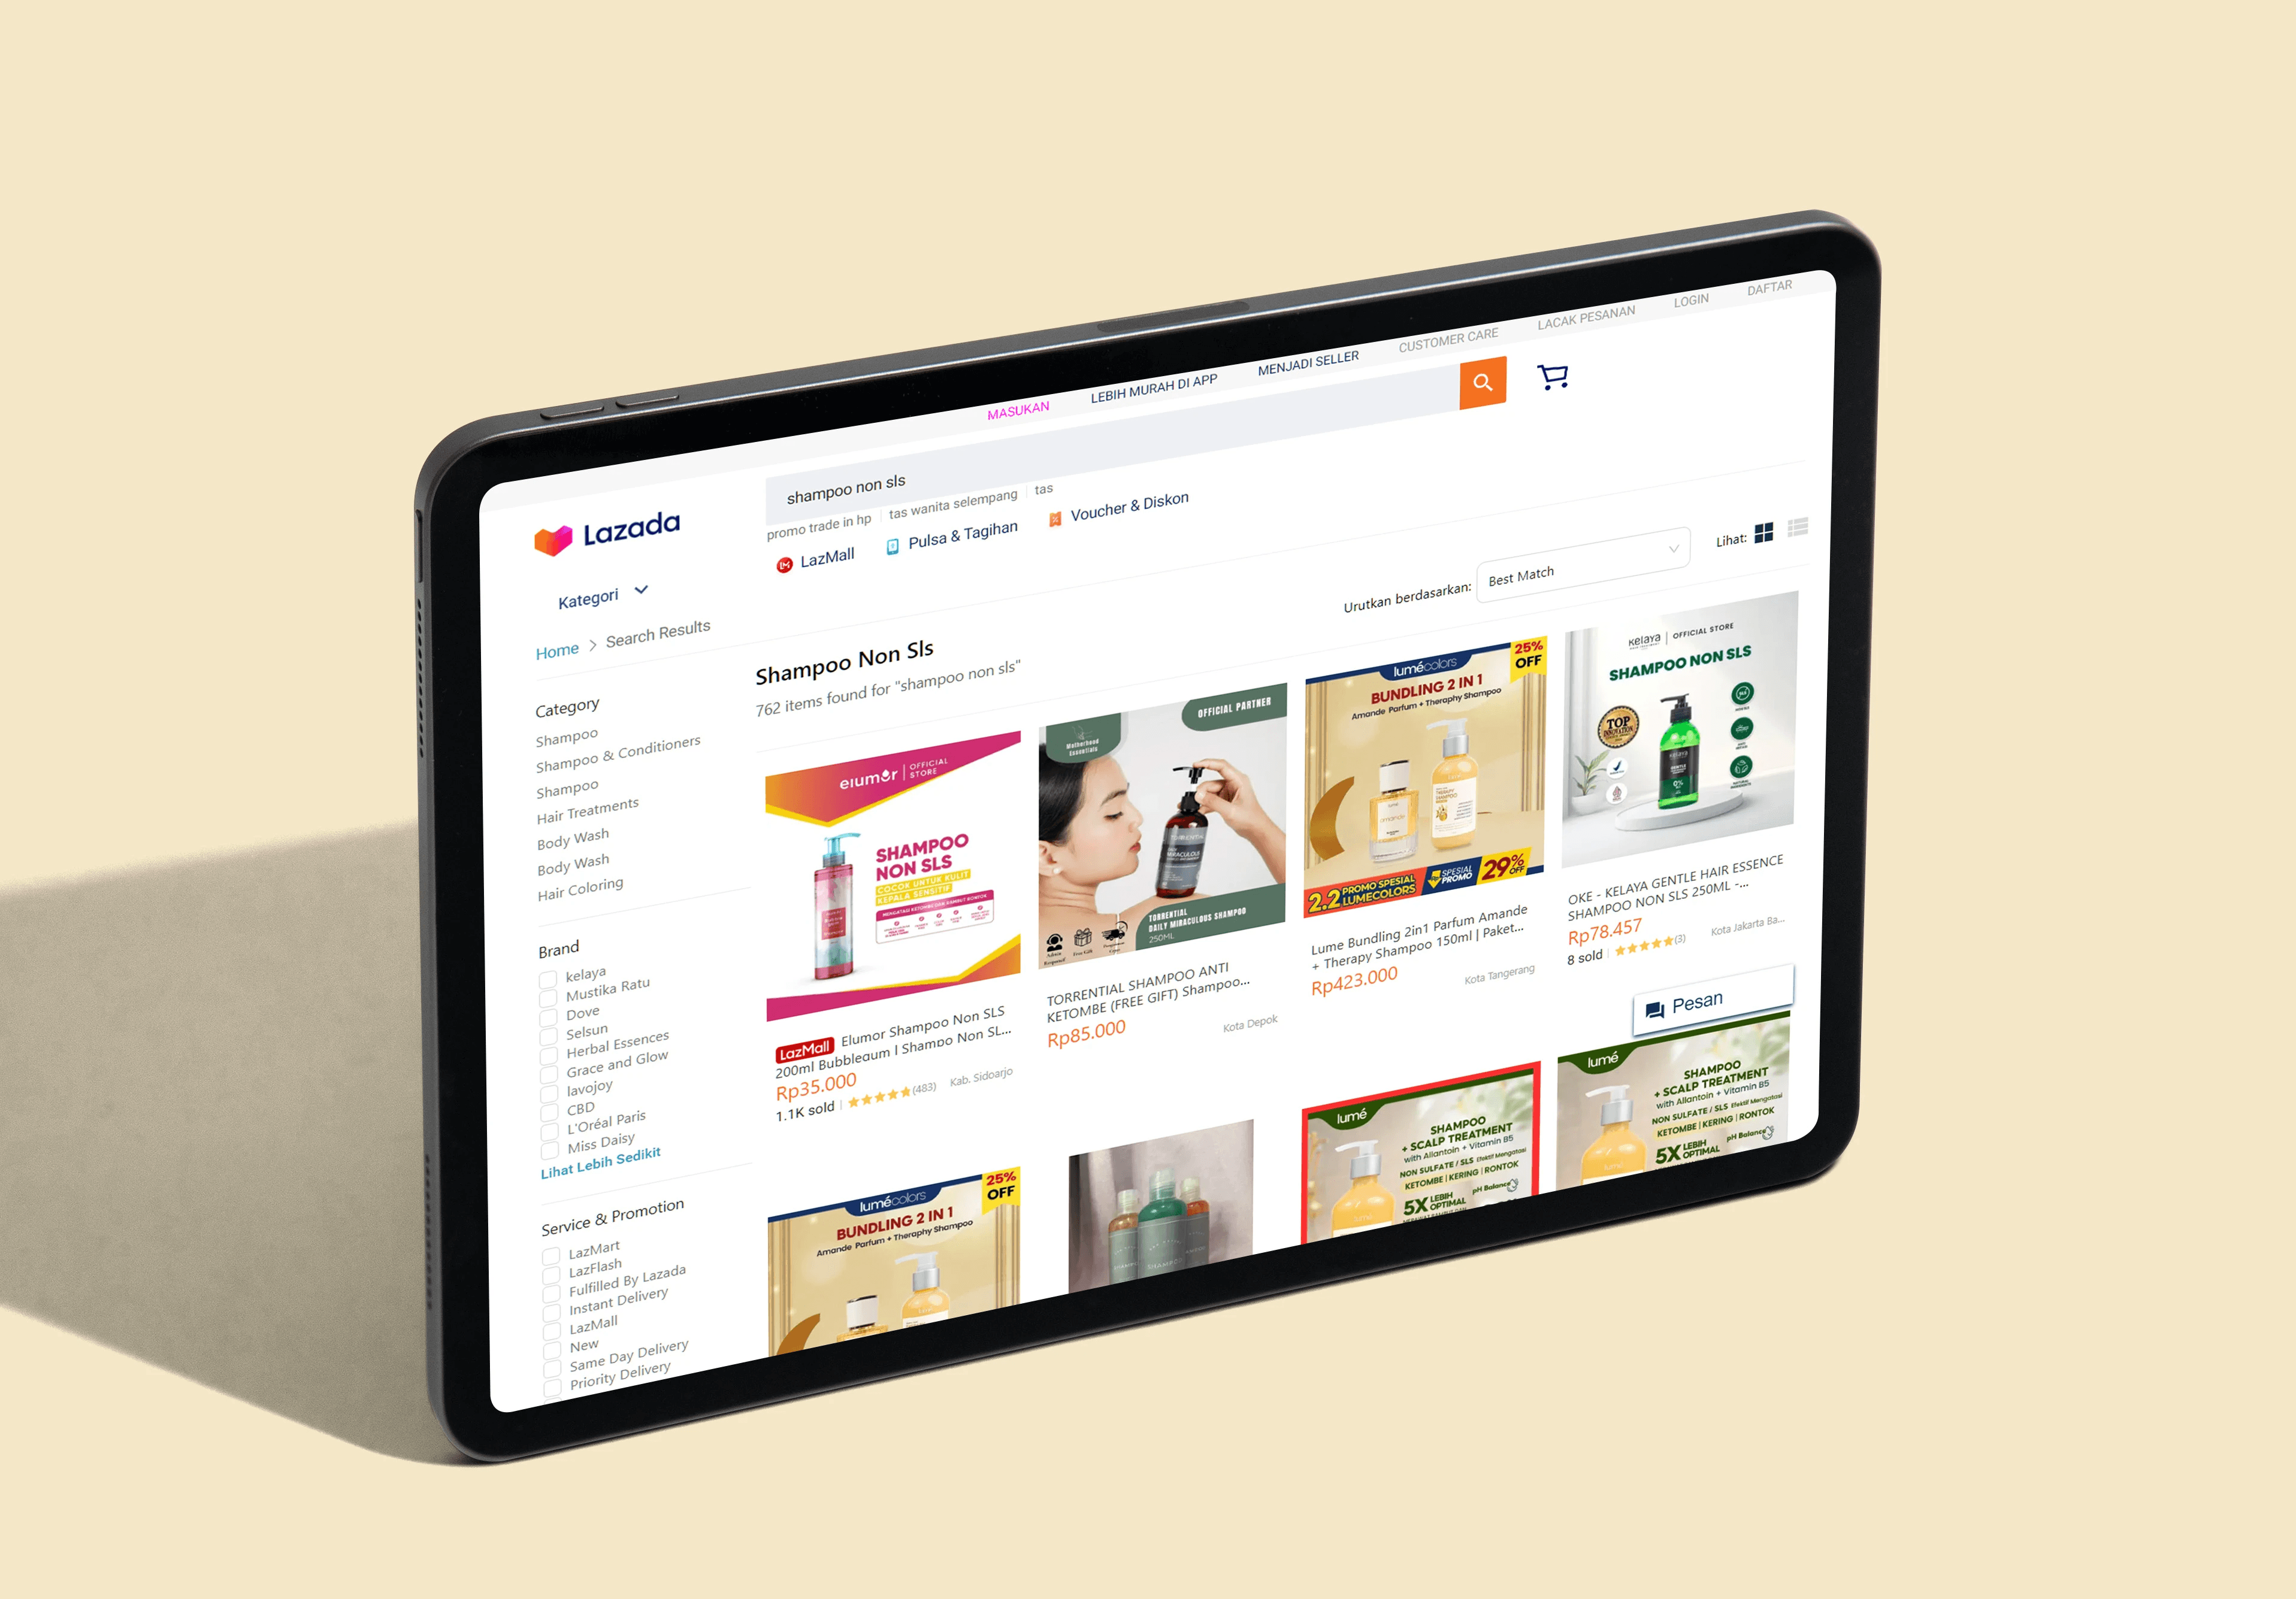
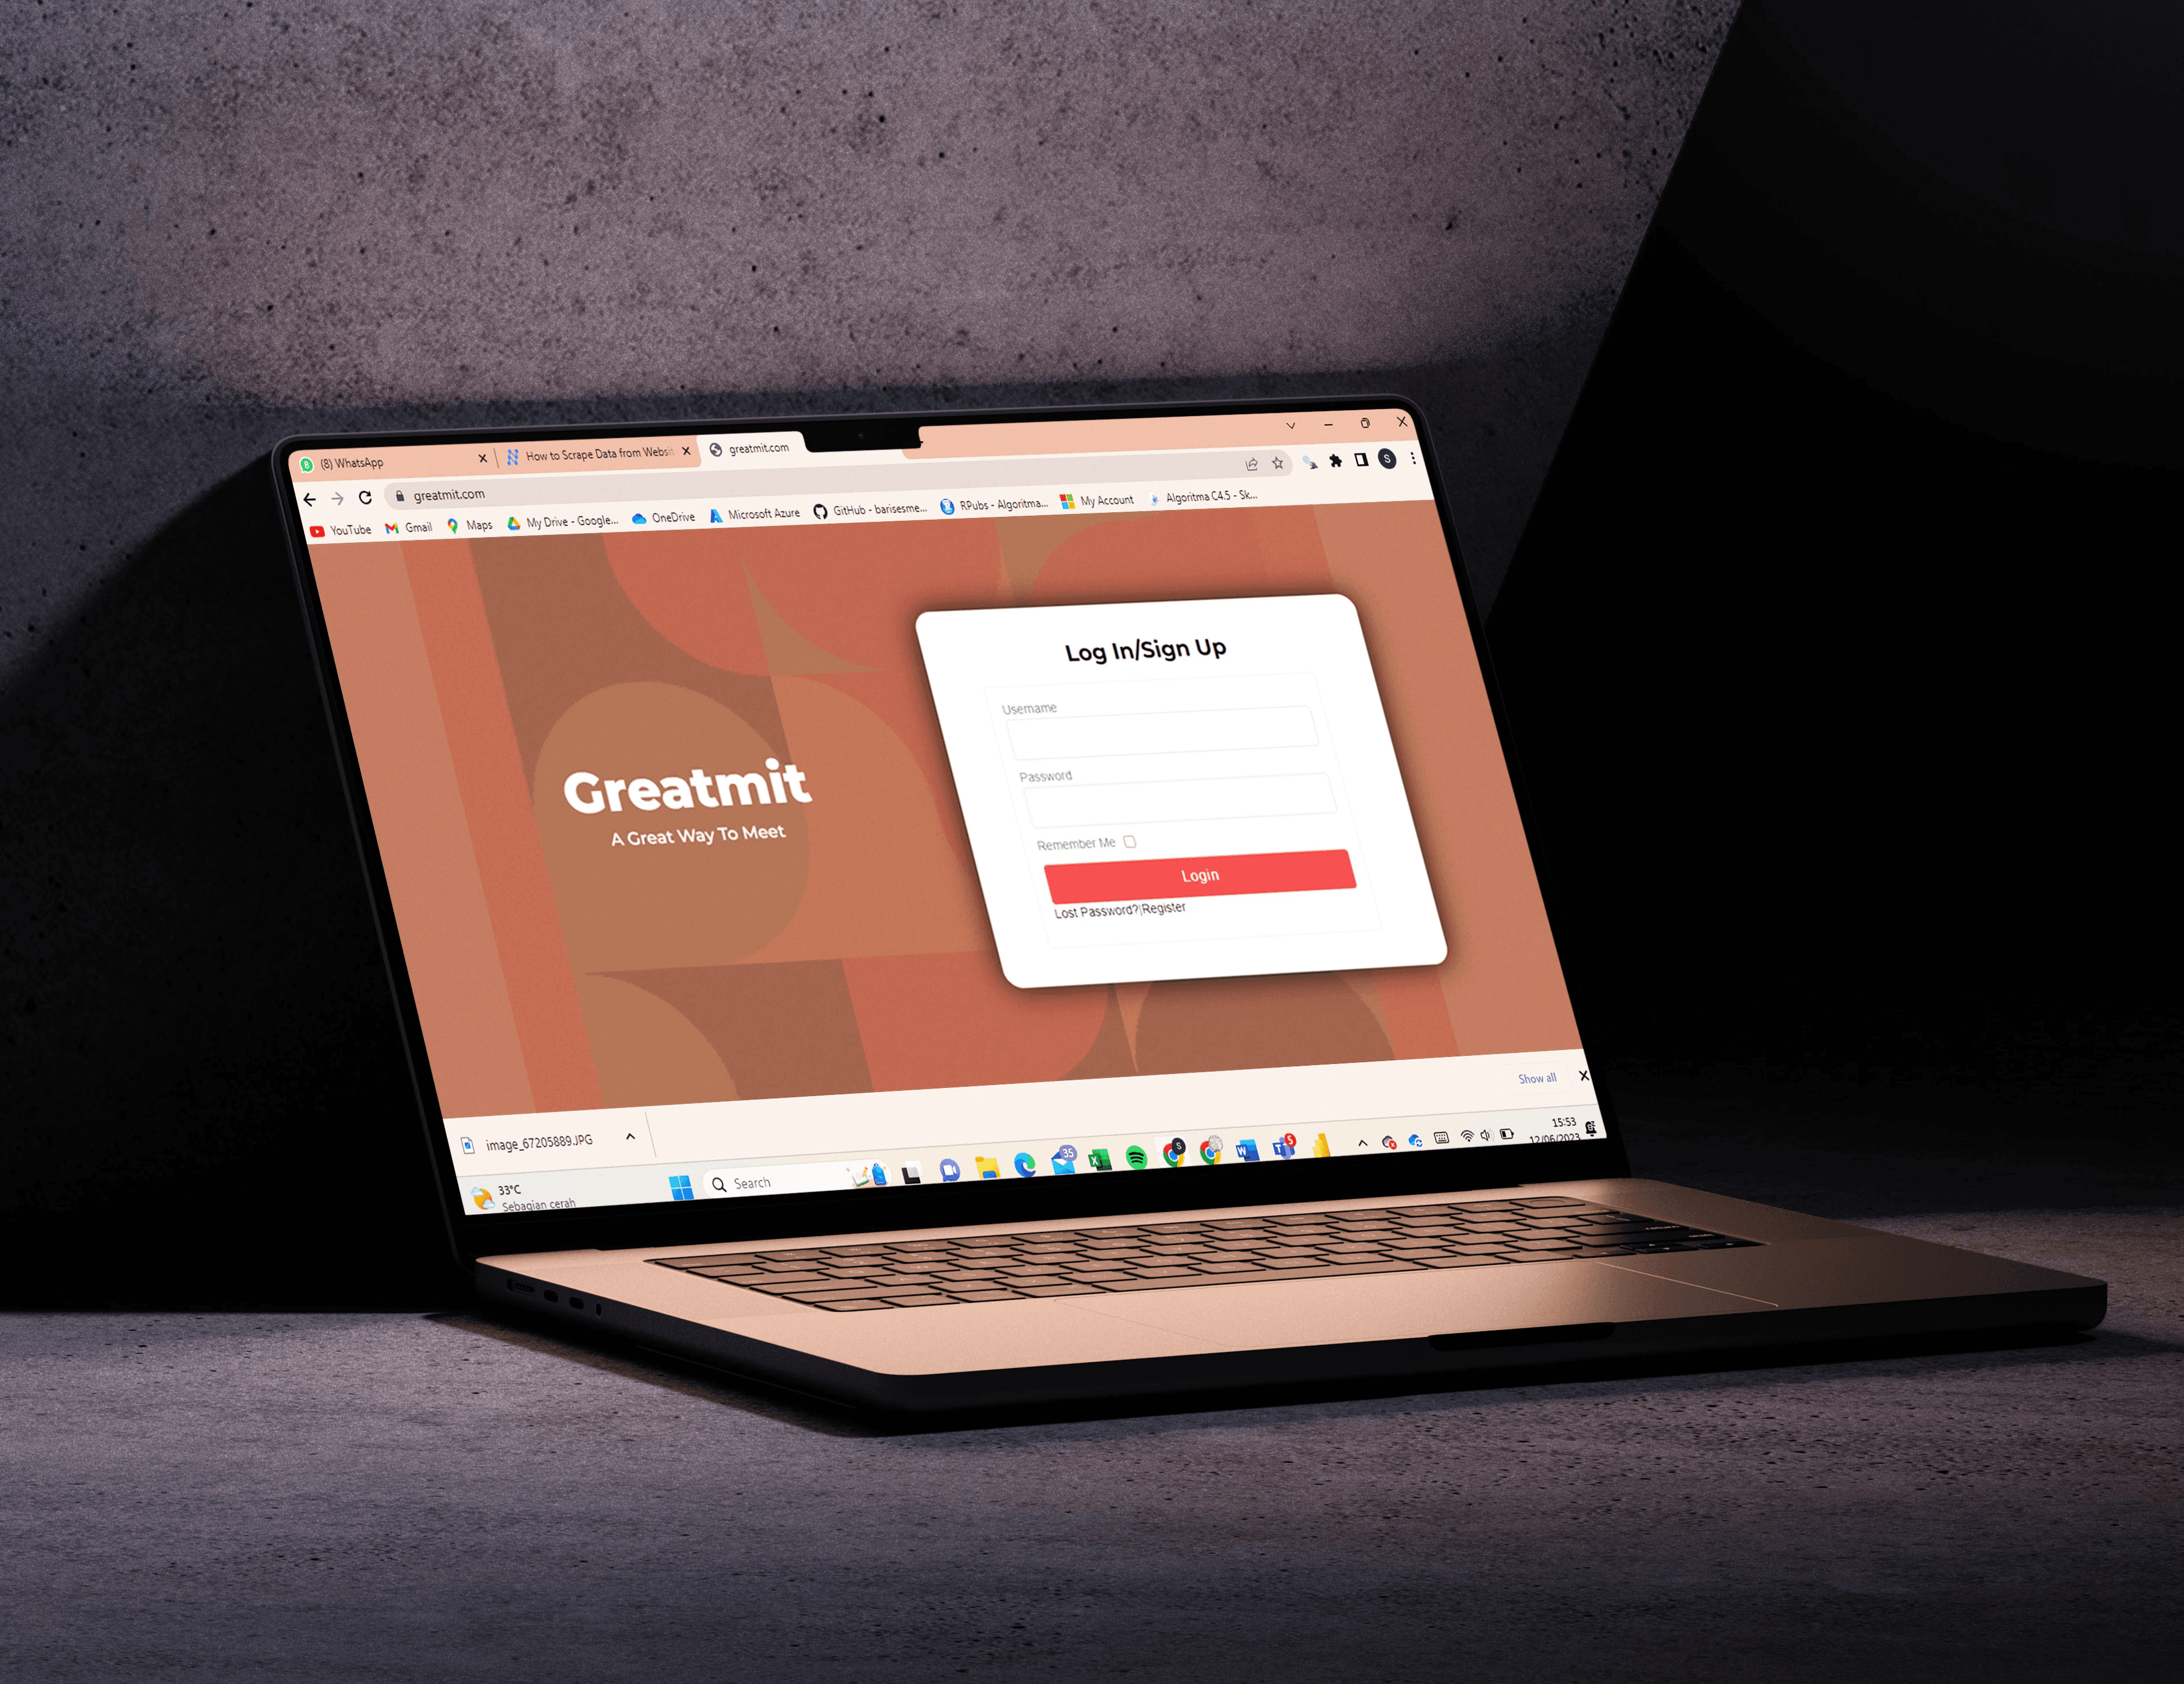
I leveraged data-driven insights to empower strategic decision-making. By scraping Shopee reviews, I identified key customer preferences and pain points to guide product improvements. I also built a dashboard that uncovered peak advertising performance in July and analyzed competitor trends through best-selling product data. This project showcases my ability to transform raw data into actionable business intelligence.

Key Performances: Web Scraping & Data Extraction, Sentimen Analysis, Content Advertising Insight, and Looker Studio Dashboard Development.

Red Pyramid
Red Pyramid
Red Pyramid

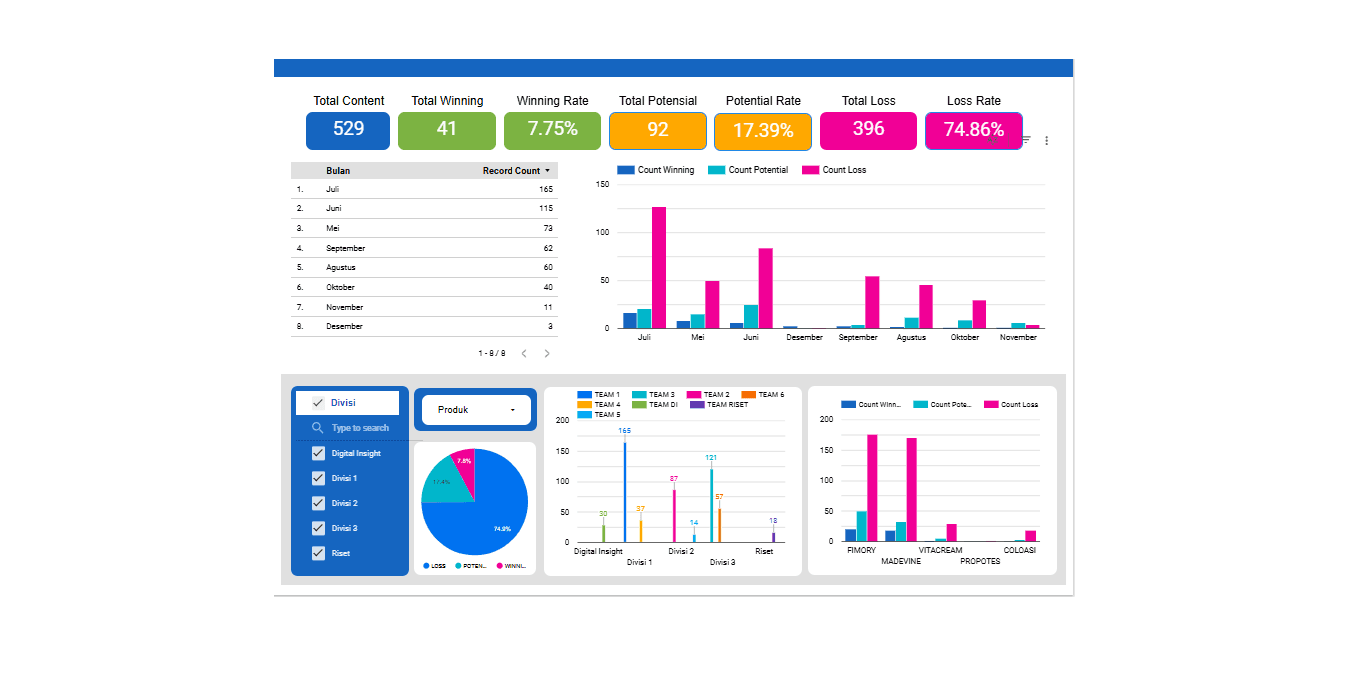
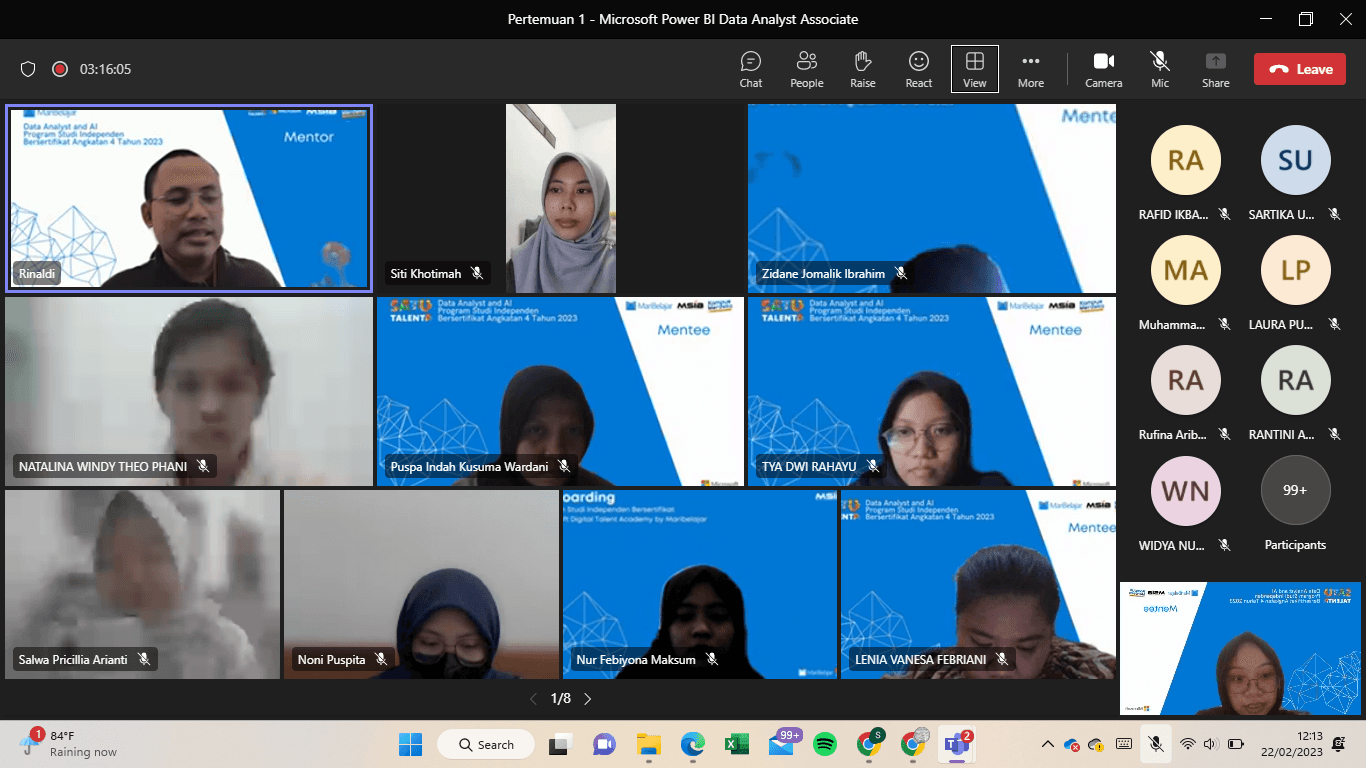
I designed and developed interactive dashboards using Power BI to turn raw, complex data into meaningful insights. This involved cleaning and structuring datasets, selecting the right visualizations to highlight key trends, and ensuring the dashboards provided actionable intelligence for decision-makers. By transforming difficult-to-read data into intuitive visuals, I enabled users to quickly grasp patterns, track performance metrics, and uncover hidden opportunities. In this program, I also learned to create a social media website that taught me about plugins, wordpress, and figma.

Key Performances: Power BI Dashboard Development, Data Cleaning & Structuring, Strategic Data Visualization, Social Media Website Development, and UI Understanding.

Blue Cube
Blue Cube
Blue Cube

02

Data Analyst and AI Program -
PT Maribelajar Indonesia Cerdas

02

Data Analyst and AI Program -
PT Maribelajar Indonesia Cerdas

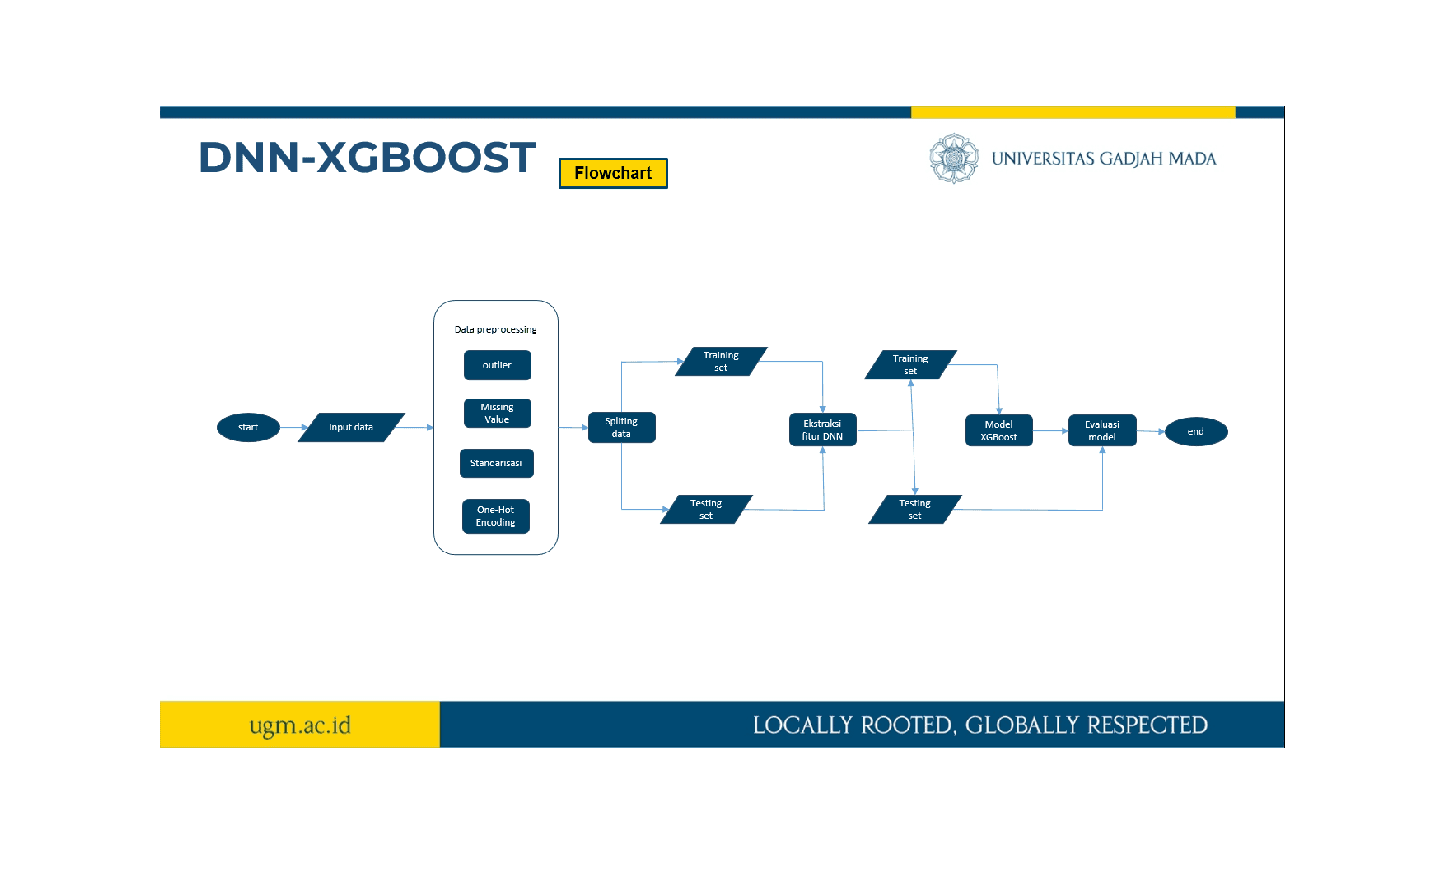
This was my first hands-on experience handling data directly from users. My main task was to check the database of customers surveyed by sales marketing and summarize credit applications using pivot tables in excel. Then I initiated a decision tree analysis to identify patterns in approved applications. By visualizing these insights, I provided a clearer understanding of customer approval trends, supporting more data-driven decision-making.

Key Performances: Customer Credit Classification using Decision Tree, Descriptive Analysis and Visualization of Credit Application.

Green Cylinder
Green Cylinder
Green Cylinder

03

Student Intern - Adira Finance

03

Student Intern - Adira Finance

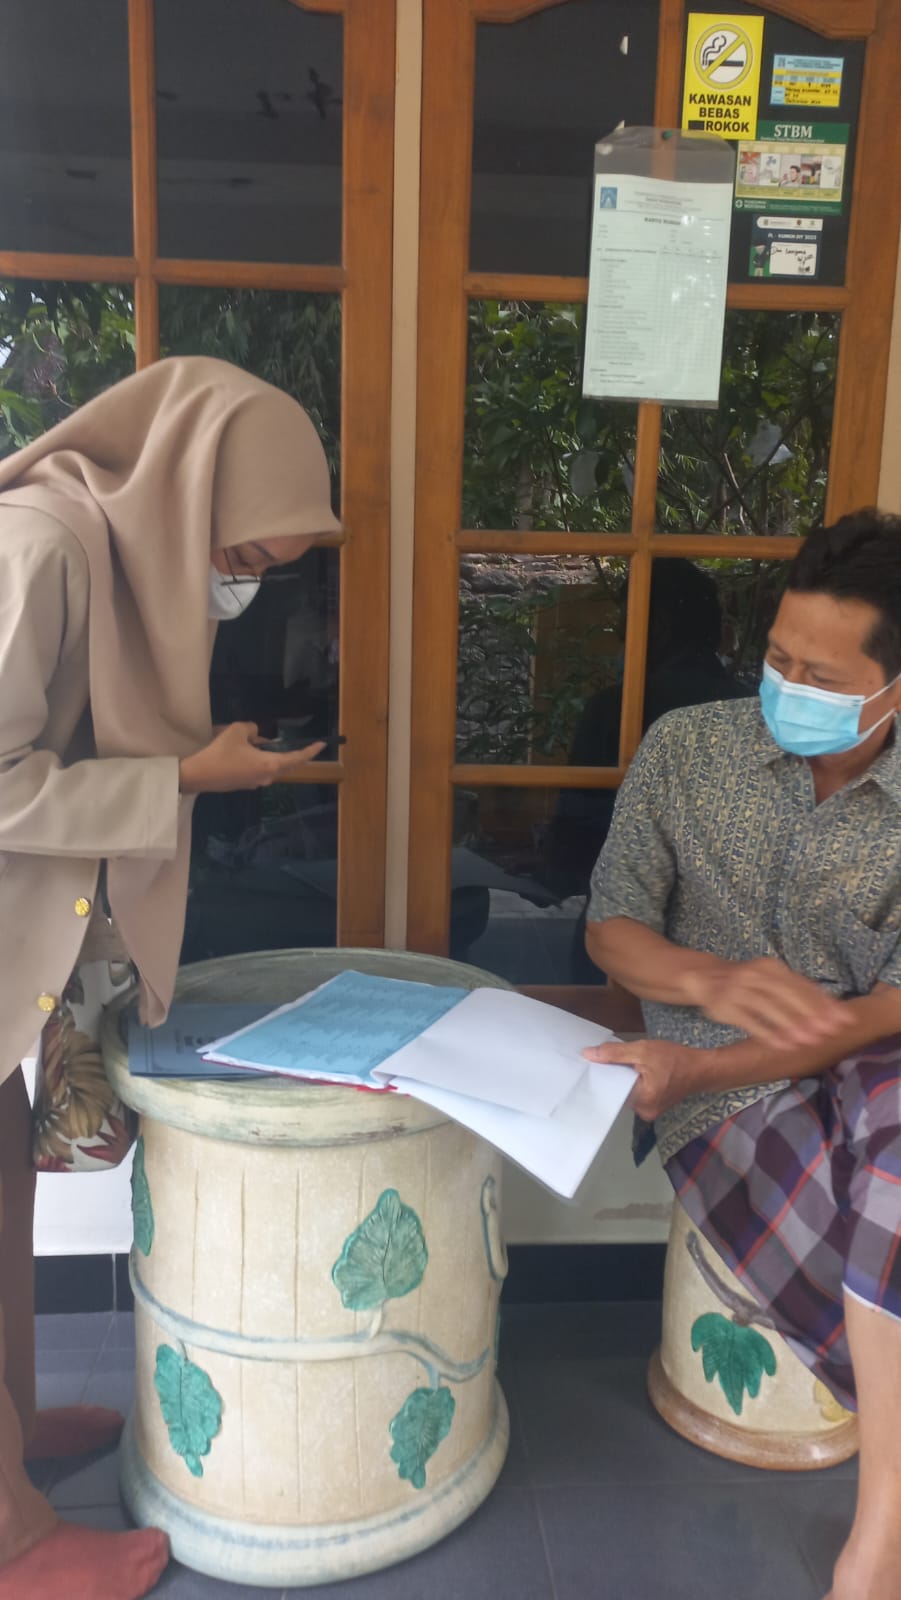
This was my first experience conducting direct data collection, engaging with respondents through surveys and interviews in underserved areas of Sleman with limited digital adoption. This role allowed me to develop hands-on skills in primary data gathering, handling real-world data challenges, and understanding user behavior in low-connectivity environments—an essential foundation for data analysis and decision-making.

Key Performances: Primary Data Collection and Survey Methodology.

Orange Sphere
Orange Sphere
Orange Sphere

04

Enumerator of Digital Literacy Survey in Sleman Regency

04

Enumerator of Digital Literacy Survey in Sleman Regency

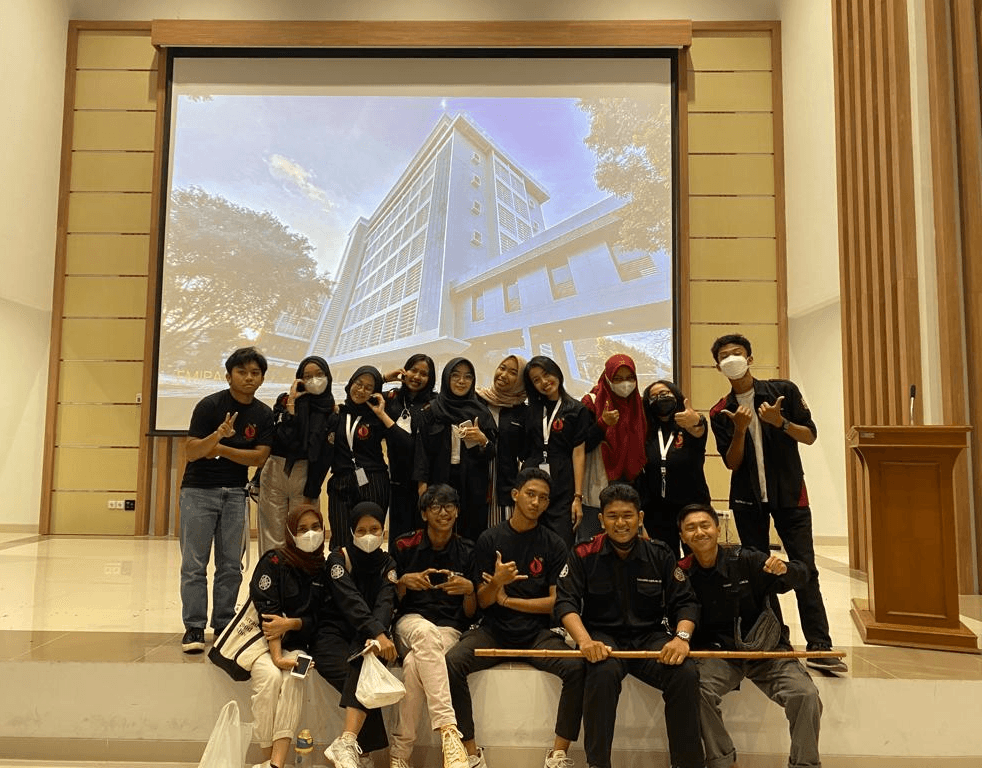
I initiated event publications for UGM students through Simaster UGM, ensuring clear and effective communication. Additionally, I optimized social media content on Instagram and TikTok, enhancing both quality and frequency to boost engagement and expand event reach. These efforts increased student participation and awareness across multiple platforms.

Key Performances: Initiated Event Publications, Social Media Optimization, and Boosted Engagement.

Purple Circle
Purple Circle
Purple Circle

05

Coordinator of Humas & Publikasi Division

05

Coordinator of Humas & Publikasi Division

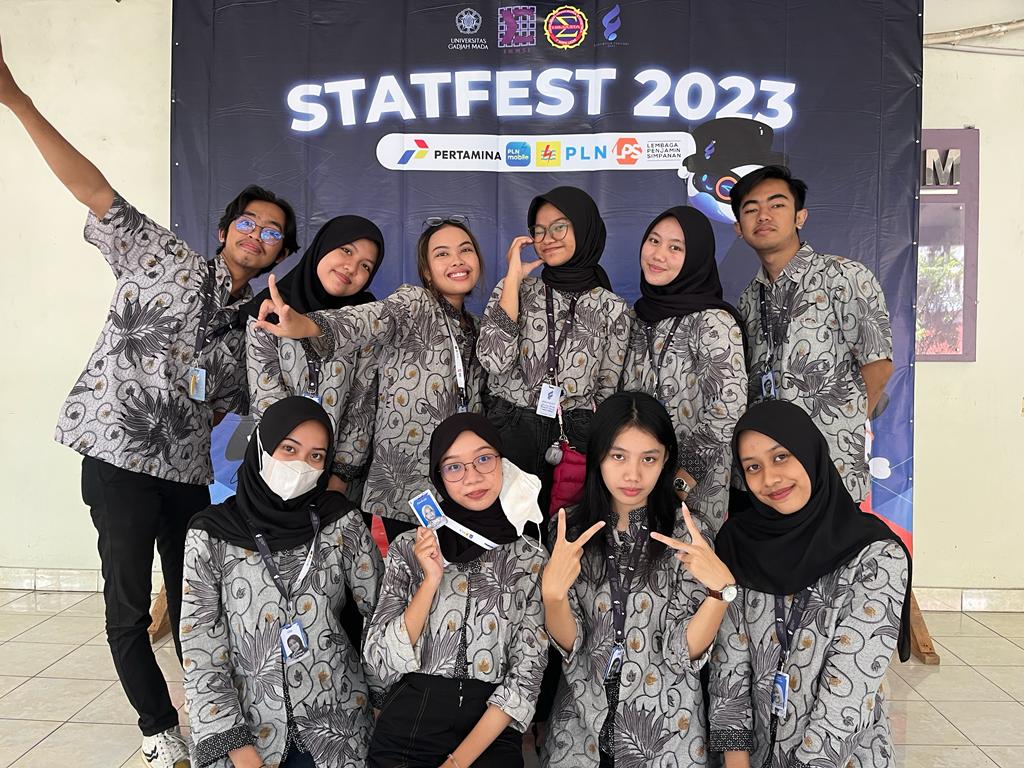
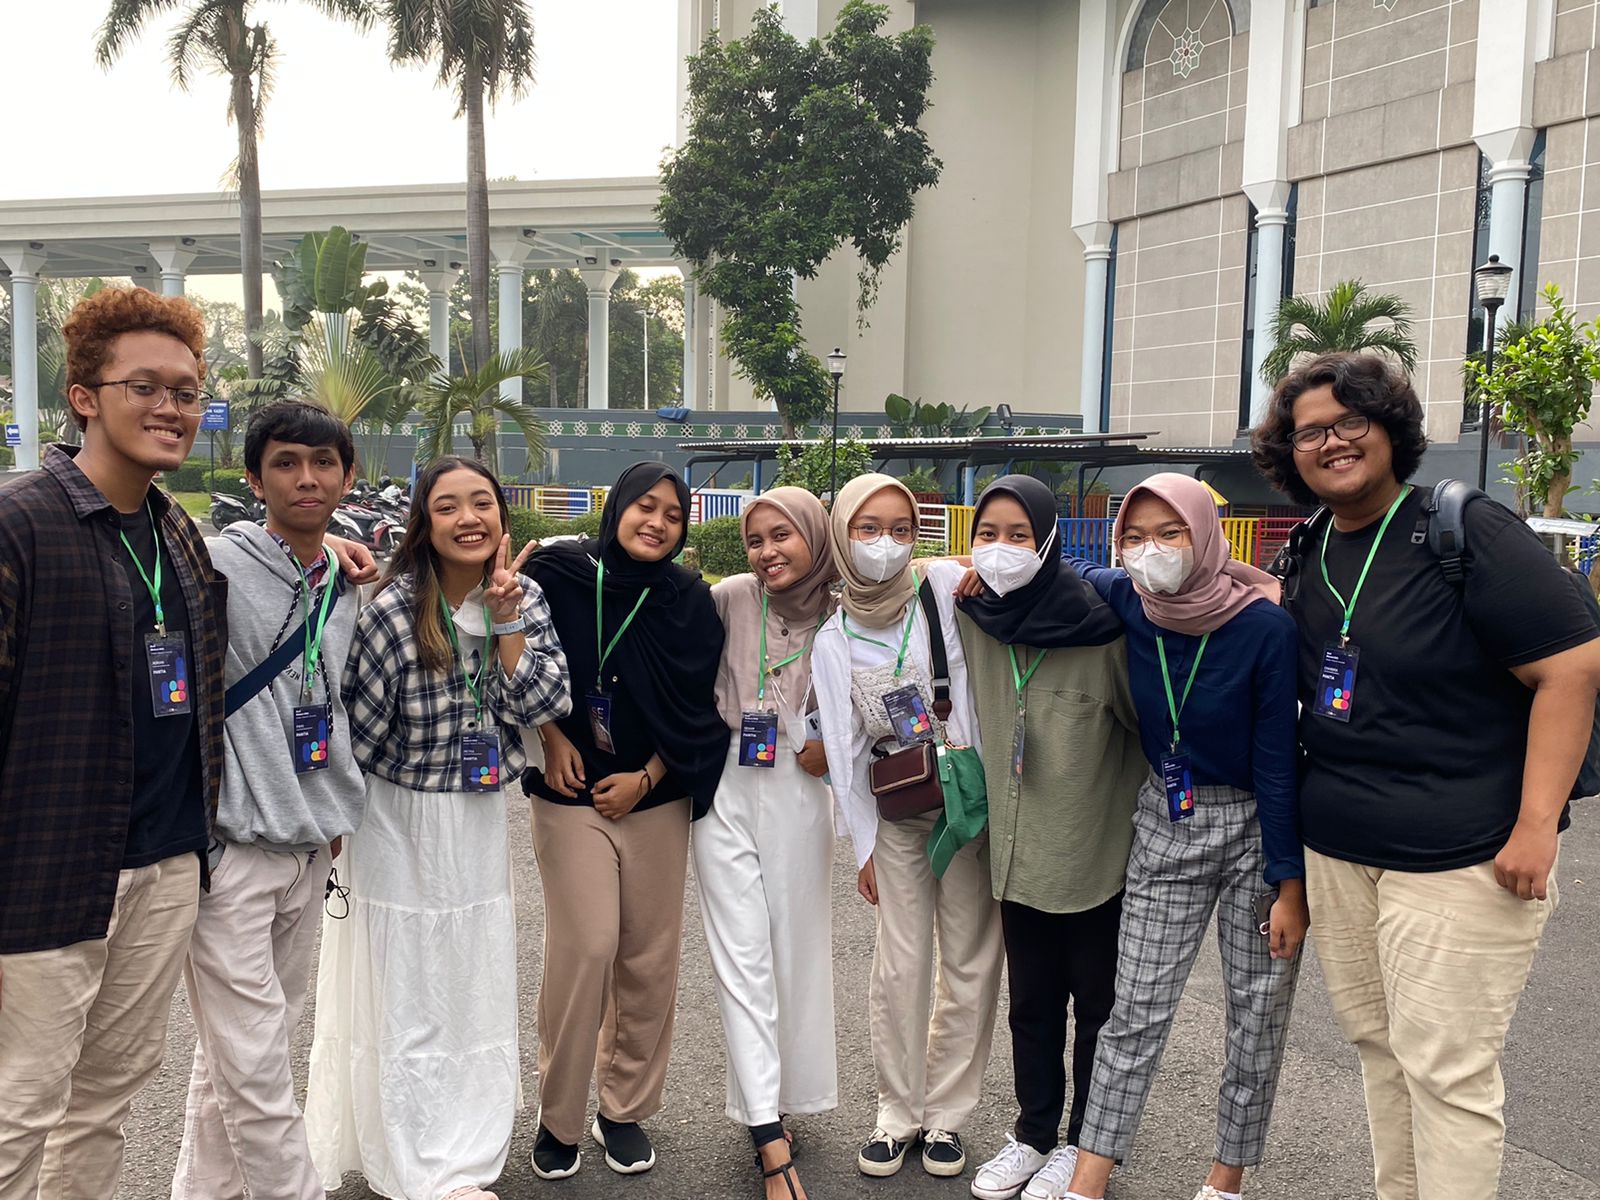
As Coordinator 2, alongside Coordinator 1, I took the initiative to revive the company visit program in Surabaya-Malang, which had been inactive for three years. Additionally, I successfully organized both offline and online ‘Association Visit’ programs, collaborating with three associations in one period. I also played a key role in reestablishing active participation in IHMSI Region III, strengthening organizational engagement at a regional level.

Key Performances: Program Revitalization, Strategic Collaboration, and Event Coordination.

Yellow Heart
Yellow Heart
Yellow Heart

06

Coordinator of HALMA (Hubungan Antar Lembaga dan Divisi)

06

Coordinator of HALMA (Hubungan Antar Lembaga dan Divisi)

I developed the social media branding and theme, ensuring a cohesive visual identity. I also executed social media designs using CorelDRAW, created standardized report templates, and edited video publications to enhance engagement and outreach.

Key Performances: Graphic Design Execution and Social Media Branding.

Orange Star
Orange Star
Orange Star

07

Creative Designer for Social Media KKN PPM UGM GiriGantari

07

Creative Designer for Social Media KKN PPM UGM GiriGantari

Galery

Galery

Galery

Galery

Galery

Galery